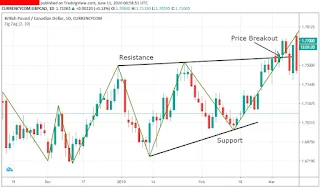
Complete Guide to ZigZag Indicator: Strategies, Calculation & Trading Techniques
📌 What is the ZigZag Indicator?
The ZigZag Indicator is a technical analysis tool used to identify trend reversals, filter market noise, and highlight significant price movements. It helps traders analyze market swings by connecting swing highs and lows with straight lines.
👉 Key Uses of ZigZag Indicator:
Identifying major trend reversals
Filtering out minor price fluctuations
Recognizing chart patterns like Elliott Waves
Spotting Fibonacci retracement and extensions
Unlike traditional indicators, the ZigZag does not predict trends but refines market movements, making it an excellent tool for price action traders.
📊 How is the ZigZag Indicator Calculated?
The ZigZag Indicator uses a percentage-based movement filter to connect significant highs and lows.
🔹 ZigZag Formula:
Select a percentage threshold (e.g., 5%) to determine significant price moves.
If the price changes by more than this threshold in one direction, a new segment is drawn.
The line continues until the price reverses by the selected percentage, signaling a new swing high or low.
✅ Example: If a stock moves 5% or more in a particular direction, the indicator will connect those points and ignore smaller fluctuations.
🔥 Best ZigZag Trading Strategies
1️⃣ Trend Identification Strategy
BUY when the ZigZag shows an upward trend (higher highs and higher lows).
SELL when the ZigZag shows a downward trend (lower highs and lower lows).
Confirm the trend using Moving Averages or RSI.
2️⃣ Support & Resistance Strategy
ZigZag helps draw support and resistance levels effectively.
BUY near support levels when ZigZag confirms a bounce.
SELL near resistance levels when ZigZag signals a pullback.
3️⃣ Fibonacci Retracement with ZigZag
Use ZigZag swings to plot Fibonacci retracement levels.
Look for reversal signals at 38.2%, 50%, or 61.8% Fibonacci levels.
BUY when price bounces at a Fibonacci level in an uptrend.
SELL when price faces resistance at a Fibonacci level in a downtrend.
4️⃣ Elliott Wave Confirmation
The ZigZag Indicator helps identify Elliott Wave patterns.
BUY when the ZigZag completes a corrective wave and starts an impulsive wave.
SELL when a corrective wave is forming after an uptrend.
5️⃣ Breakout Trading Strategy
BUY when ZigZag confirms a breakout above key resistance levels.
SELL when ZigZag confirms a breakdown below key support levels.
Combine with volume indicators for stronger confirmation.
⏳ Best Timeframes for ZigZag Indicator
📌 Short-Term Trading (Intraday & Scalping):
5-minute, 15-minute, 1-hour charts
Works well for quick reversals and momentum trades
📌 Swing Trading (Medium-Term):
4-hour, daily charts
Useful for spotting major price swings & retracements
📌 Long-Term Investing:
Weekly, monthly charts
Ideal for trend-following and major market reversals
📈 Stocks & Indices Suitable for ZigZag Indicator
✅ Best Stocks for ZigZag Strategies:
Highly liquid and volatile stocks (e.g., Tesla, Apple, Reliance, Infosys)
Trending stocks with clear price swings
✅ Best Indices for ZigZag Strategies:
NIFTY 50, SENSEX, S&P 500, NASDAQ, Dow Jones
Commodities & Forex pairs with strong trends
🎯 Stop-Loss & Target Setting with ZigZag
✅ Stop-Loss Placement:
Below the latest swing low in an uptrend (BUY trades)
Above the latest swing high in a downtrend (SELL trades)
✅ Target Placement:
Previous swing high/lows
Fibonacci extension levels
Risk-reward ratio of 1:2 or higher
ZigZag Indicator Internal Settings
- Threshold: Set the minimum percentage or point change required to draw a new line.
- Depth, Deviation, and Backstep: Advanced settings to fine-tune the indicator’s sensitivity.
🚀 Advanced ZigZag Variants & Techniques
🔹 ZigZag with RSI & MACD
BUY when ZigZag confirms an uptrend & RSI > 50.
SELL when ZigZag confirms a downtrend & MACD crossover is bearish.
🔹 ZigZag with Bollinger Bands
BUY when the ZigZag bottom aligns with the lower Bollinger Band.
SELL when the ZigZag peak aligns with the upper Bollinger Band.
🔹 Multiple Timeframe Analysis
Use higher timeframes for trend confirmation.
Trade ZigZag signals only when aligned with the higher timeframe trend.
🔥 Final Thoughts: Should You Use the ZigZag Indicator?
✅ The ZigZag Indicator is great for identifying major trends & reversals.
✅ Best when combined with Fibonacci, RSI, MACD, and Moving Averages.
✅ Avoid using ZigZag alone; always use confirmation indicators.
💡 Bonus Tip: The ZigZag Indicator works best in trending markets rather than sideways movements.
📢 Do you use the ZigZag Indicator in your trading? Share your thoughts in the comments! 🚀
#ZigZagIndicator #TechnicalAnalysis #StockMarket #TradingIndicators #PriceAction #SwingTrading #DayTrading
Meta Description: Discover everything you need to know about the ZigZag Indicator in trading. Learn how to calculate it, strategies to use, and advanced tips to maximize your profits. Perfect for stocks, forex, and indices!


