Fibonacci Retracement: A Complete Guide for Traders
🔥 What is Fibonacci Retracement?
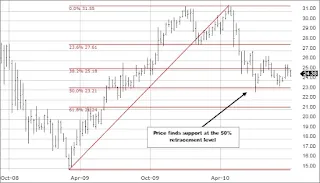
Fibonacci Retracement (Fib Levels) is a popular technical analysis tool used to identify potential support and resistance levels based on the Fibonacci sequence. Traders use it to find retracement levels where the price might reverse or continue its trend.
🏆 Why is Fibonacci Retracement Important?
✅ Helps identify potential price reversal zones
✅ Used in stock, forex, and crypto trading
✅ Works well with other indicators like RSI, MACD, and Moving Averages
📊 How to Calculate Fibonacci Retracement Levels?
Fibonacci levels are derived from the Fibonacci sequence (0, 1, 1, 2, 3, 5, 8, 13...). The key retracement levels are:
- 0.236 (23.6%)
- 0.382 (38.2%)
- 0.500 (50.0%) (not an actual Fibonacci number but widely used)
- 0.618 (61.8%)
- 0.786 (78.6%)
✅ Fibonacci Retracement Formula:
To calculate Fibonacci levels, follow these steps:
1️⃣ Identify the swing high (recent peak) and swing low (recent bottom).
2️⃣ Subtract the low from the high.
3️⃣ Multiply by Fibonacci ratios (23.6%, 38.2%, 50%, 61.8%, 78.6%).
4️⃣ Subtract these values from the high to get retracement levels.
Example Calculation:
- Swing High = 1000, Swing Low = 800
- Difference = 1000 - 800 = 200
- 23.6% Level: 1000 - (200 * 0.236) = 952.8
- 38.2% Level: 1000 - (200 * 0.382) = 923.6
- 50% Level: 1000 - (200 * 0.500) = 900
- 61.8% Level: 1000 - (200 * 0.618) = 876.4
These levels act as support or resistance in price movements.
🚀 Top Fibonacci Retracement Trading Strategies
1️⃣ Fibonacci + Trend Trading
- Draw Fibonacci levels on a trending stock.
- Look for price retracing to the 38.2%, 50%, or 61.8% level.
- BUY in an uptrend when price bounces from support.
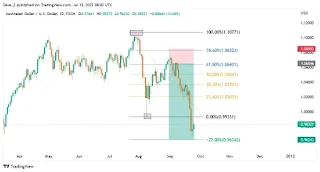
- SELL in a downtrend when price rejects resistance.
2️⃣ Fibonacci + Moving Averages Strategy
- Combine 50 EMA or 200 EMA with Fibonacci levels.
- If a retracement level aligns with a moving average, it's a strong support/resistance zone.
- Enter trades when the price bounces from these levels.
3️⃣ Fibonacci + RSI Strategy
- Wait for price to hit a Fibonacci level.
- Check RSI (Relative Strength Index):
✅ BUY if RSI is oversold (below 30) near Fib support.
✅ SELL if RSI is overbought (above 70) near Fib resistance.
4️⃣ Fibonacci + Breakout Strategy
- Price often consolidates at Fibonacci retracement zones before breaking out.
- BUY when price breaks above 61.8% level with high volume.
- SELL when price breaks below 38.2% level with high volume.
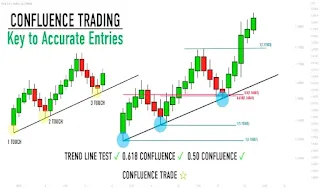
5️⃣ Fibonacci Confluence Strategy
- Look for areas where multiple Fibonacci levels overlap (from different timeframes).
- Stronger confluence zones mean higher probability trades.
⏳ Best Timeframes for Fibonacci Trading
📌 Scalping & Intraday: Use 5m, 15m, 30m charts.
📌 Swing Trading: Use 1H, 4H, Daily charts.
📌 Long-Term Investing: Use Weekly, Monthly charts.
Tip: Higher timeframes = stronger signals.
📈 Stocks & Indices That Work Well with Fibonacci
✅ Best Stocks for Fibonacci Retracement:
- Reliance Industries (RIL)
- Tata Motors
- HDFC Bank
- Infosys
- Adani Enterprises
✅ Best Indices for Fibonacci Retracement:
- NIFTY 50, SENSEX, S&P 500, NASDAQ, Dow Jones
🎯 How to Set Stop-Loss & Targets in Fibonacci Trading?
✅ Stop-Loss Placement:
- Below 61.8% level in an uptrend.
- Above 38.2% level in a downtrend.
✅ Target Placement:
- Take profit at 23.6%, 38.2%, or 50% retracement levels.
- Use previous swing highs/lows as target points.
🔥 Advanced Fibonacci Trading Techniques
1️⃣ Fibonacci Extensions (For Profit Targets)
Fibonacci extension levels (1.272, 1.618, 2.618, etc.) help predict where price might move after a breakout.
2️⃣ Fibonacci Time Zones
Used to predict when a price movement may occur, not just where.
3️⃣ Fibonacci Arcs & Fans
Additional tools to identify dynamic support & resistance levels.
🚀 Final Thoughts: Should You Use Fibonacci Retracement?
✅ Fibonacci is a powerful tool for identifying market reversals.
✅ Works best when combined with RSI, MACD, Moving Averages, and Trendlines.
✅ Avoid in choppy markets with no clear trend.
💡 Bonus Tip: Use Fibonacci with other technical indicators for higher accuracy in trading! 🚀
📢 Do you use Fibonacci Retracement in your trading? Share your thoughts in the comments!
#FibonacciRetracement #TechnicalAnalysis #StockMarket #TradingIndicators #ForexTrading #CryptoTrading #SwingTrading


