Elliott Wave Theory: A Complete Guide to Trading Strategies, Examples, and Advanced Techniques
What is Elliott Wave Theory?
Elliott Wave Theory (EWT) is a form of technical analysis used to predict price movements by identifying repetitive wave patterns in the market. Developed by Ralph Nelson Elliott, this theory suggests that markets move in predictable cycles influenced by investor psychology.
👉 Key Uses of Elliott Wave Theory:
Identifying market trends and reversals
Understanding price cycles
Timing entry and exit points effectively
📊 Elliott Wave Structure & Patterns
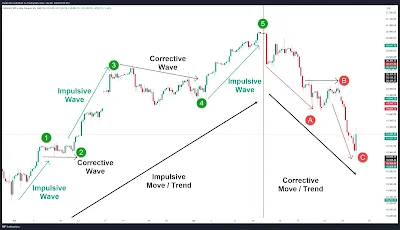
Elliott Wave Theory consists of two main phases: Impulse Waves and Corrective Waves.
🔹 Impulse Waves (Trending Phase)
Impulse waves move in the direction of the overall trend and consist of five sub-waves:
1️⃣ Wave 1: Initial price increase/decrease with low investor interest. 2️⃣ Wave 2: A slight retracement but doesn’t break the start of Wave 1. 3️⃣ Wave 3: The strongest and longest wave, often driven by big investors. 4️⃣ Wave 4: Another retracement, usually shallower than Wave 2. 5️⃣ Wave 5: Final push in the direction of the trend before a reversal.
🔹 Corrective Waves (Retracement Phase)
After the impulse waves, the price undergoes a correction, forming a three-wave pattern (A-B-C):
🔸 Wave A: Price starts reversing from the peak/trough. 🔸 Wave B: A temporary pullback or retracement. 🔸 Wave C: Final move in the correction, resuming the overall trend.
✅ Key Rule: Wave 3 is never the shortest among Waves 1, 3, and 5!
🔥 Best Elliott Wave Trading Strategies
1️⃣ Impulse Wave Trading Strategy
BUY in Wave 2 retracement (Fibonacci 50%-61.8%) and target Wave 3.
SELL near Wave 5 peaks and prepare for correction.
2️⃣ Corrective Wave Trading Strategy
Identify an A-B-C correction and enter at Wave C completion.
Set stop-loss at the end of Wave A and target the next impulse wave.
3️⃣ Elliott Wave + Fibonacci Strategy
Use Fibonacci retracements to predict Wave 2 and Wave 4 pullbacks.
Key retracement levels: 38.2%, 50%, and 61.8%.
4️⃣ Elliott Wave + RSI Strategy
Identify Wave 3 peaks with overbought RSI (>70) for profit booking.
Identify Wave 2 & 4 corrections with oversold RSI (<30) for entry.
5️⃣ Elliott Wave + Moving Average Strategy
Use the 50 EMA or 200 EMA to confirm trend direction.
Enter BUY trades when price is above moving average after Wave 2.
6️⃣ Breakout Strategy with Elliott Wave
Enter BUY trades when price breaks the Wave 4 resistance.
Enter SELL trades when price breaks the Wave B support.
⏳ Best Timeframes for Elliott Wave Trading
📌 Short-Term Traders: 15 min, 1-hour chart (for day trading and scalping)
📌 Swing Traders: 4-hour, daily chart (for medium-term trading)
📌 Long-Term Investors: Weekly, monthly chart (for big wave analysis)
📈 Stocks & Index Trading Using Elliott Wave Theory
✅ Best Stocks for Elliott Wave Analysis:
Highly liquid and trending stocks
Large-cap stocks with strong momentum
✅ Best Indices for Elliott Wave Trading:
NIFTY 50, SENSEX, S&P 500, NASDAQ, Dow Jones
🎯 Stop-Loss & Target in Elliott Wave Trading
✅ Stop-Loss Placement:
Below Wave 1 low for BUY trades (after Wave 2 correction)
Above Wave B high for SELL trades (after Wave C correction)
✅ Target Placement:
Wave 3 extension (typically 1.618x of Wave 1)
Wave 5 peak (previous swing high or Fibonacci extension levels)
🚀 Advanced Elliott Wave Variants & Techniques
🔹 Leading Diagonal & Ending Diagonal Patterns
Used in Wave 1 and Wave 5 formations.
🔹 Expanding Triangle Pattern
Forms during corrective waves Wave B or Wave 4.
🔹 Fractal Nature of Elliott Waves
Smaller Elliott Waves exist within larger Elliott Waves.
🔥 Final Thoughts: Should You Use Elliott Wave Theory?
✅ Elliott Wave Theory is powerful for understanding market psychology. ✅ Best when combined with Fibonacci, RSI, and Moving Averages. ✅ Requires practice & patience to correctly identify wave patterns.
💡 Bonus Tip: Elliott Wave works best when combined with fundamental market trends & volume confirmation!
📢 Do you use Elliott Wave Theory in your trading? Share your thoughts in the comments! 🚀
#ElliottWave #TechnicalAnalysis #StockMarket #TradingIndicators #PriceAction #SwingTrading #DayTrading
Meta Description:
"Learn everything about Elliott Wave Theory – from basics to advanced strategies. Discover how to use Elliott Wave Theory for trading, set stop-loss and targets, and apply it to stocks and indices. Perfect for beginners and pros!"


