Complete Guide to Pivot Points: Calculation, Strategies & Trading Insights
📌 What Are Pivot Points?
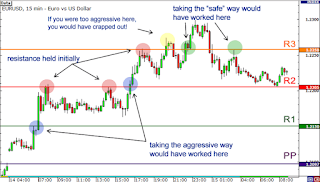
Pivot Points are key price levels used by traders to determine potential support and resistance zones. They are calculated based on the previous day's high, low, and close prices.
✅ Why Use Pivot Points?
Identify intraday support & resistance levels.
Predict potential price reversals.
Useful for day trading, swing trading & scalping.
Helps in setting stop-loss & targets effectively.
📊 How to Calculate Pivot Points
The standard Pivot Point formula is:
🔹 Pivot Point (PP) = (High + Low + Close) / 3
Once you calculate the PP, the support and resistance levels are derived:
🔹 First Resistance (R1) = (2 × PP) - Low
🔹 First Support (S1) = (2 × PP) - High
🔹 Second Resistance (R2) = PP + (High - Low)
🔹 Second Support (S2) = PP - (High - Low)
🔹 Third Resistance (R3) = High + 2 × (PP - Low)
🔹 Third Support (S3) = Low - 2 × (High - PP)
✅ Example Calculation: If a stock’s high, low, and close prices are 100, 95, and 98, then:
PP = (100 + 95 + 98) / 3 = 97.67
R1 = (2 × 97.67) - 95 = 100.34
S1 = (2 × 97.67) - 100 = 95.34
... and so on.
🔥 Best Pivot Points Trading Strategies
1️⃣ Pivot Point Bounce Strategy
BUY when the price bounces off Support (S1, S2, or S3).
SELL when the price reverses from Resistance (R1, R2, or R3).
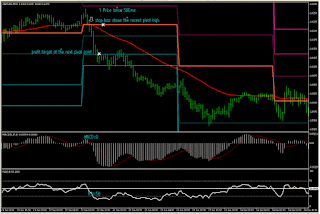
Place stop-loss below support (for BUY) and above resistance (for SELL).
2️⃣
Breakout Strategy
BUY if price breaks above R1 with high volume.
SELL if price breaks below S1 with high volume.
Stop-loss at previous support/resistance level.
3️⃣ Pivot Point & Moving Average Crossover
BUY when price is above the Pivot Point and 50 EMA.
SELL when price is below the Pivot Point and 50 EMA.
4️⃣ Pivot Points & RSI Combo
BUY when RSI crosses above 30 near a Pivot Support level.
SELL when RSI crosses below 70 near a Pivot Resistance level.
5️⃣ Pivot Points & MACD Strategy
BUY when MACD shows bullish crossover near support.
SELL when MACD shows bearish crossover near resistance.
⏳ Best Timeframes for Pivot Points
📌 Intraday Traders: Use 15-min or 30-min charts.
📌 Swing Traders: Use 1-hour or daily charts.
📌 Long-Term Traders: Use weekly or monthly charts.
Pivot Points Internal Settings
Most platforms allow you to customize Pivot Points. Here are the key settings:
- Timeframe: Choose the timeframe for calculating Pivot Points (e.g., daily, weekly, monthly).
- Calculation Method: Select the method (e.g., Standard, Fibonacci, Woodie, Camarilla).
- Levels: Adjust the number of support/resistance levels (e.g., R1, R2, R3, S1, S2, S3).
📈 Stocks & Index Trading Using Pivot Points
✅ Best Stocks for Pivot Point Strategies:
High liquidity & volatility stocks.
Large-cap stocks like Reliance, TCS, Infosys.
✅ Best Indices for Pivot Point Strategies:
NIFTY 50, SENSEX, S&P 500, NASDAQ, Dow Jones.
🎯 Stop-Loss & Target Placement in Pivot Point Trading
✅ Stop-Loss Placement:
Below the Pivot Support for BUY trades.
Above the Pivot Resistance for SELL trades.
✅ Target Placement:
First target: Next pivot level (e.g., R1 or S1).
Second target: R2 or S2 for extended moves.
🚀 Advanced Pivot Point Variants
🔹 Fibonacci Pivot Points:
Uses Fibonacci ratios (0.382, 0.618, etc.) for support/resistance.
🔹 Camarilla Pivot Points:
Helps in range-bound trading with multiple S/R levels.
🔹 Woodie’s Pivot Points:
Places more emphasis on the current closing price.
🔹 Demark Pivot Points:
More effective for trend-based markets.
Advanced Pivot Points Techniques
Combining with Other Indicators:
Use RSI to confirm overbought/oversold conditions.
Use MACD to confirm trend direction.
Multiple Timeframe Analysis:
Use Pivot Points on higher timeframes to identify the trend and lower timeframes for entries.
Volume Analysis:
Use volume to confirm breakouts or reversals at Pivot Point levels.
🔥 Final Thoughts: Should You Use Pivot Points?
✅ Great for intraday & swing traders.
✅ Best when combined with RSI, MACD & moving averages.
✅ Works best in trending & volatile markets.
❌ Not useful in extremely choppy markets.
📢 Do you use Pivot Points in your trading? Let us know in the comments! 🚀
#PivotPoints #StockMarket #TradingStrategies #TechnicalAnalysis #ForexTrading #IntradayTrading #DayTrading
Meta Description:
"Learn everything about Pivot Points – from basics to advanced strategies. Discover how to use Pivot Points for trading, set stop-loss and targets, and apply them to stocks and indices. Perfect for beginners and pros!"


