Bollinger Bands: A Complete Guide to Trading Strategies, Examples, and Advanced Techniques
📌 What are Bollinger Bands?
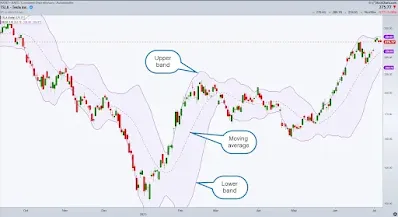
Bollinger Bands are a popular technical analysis indicator developed by John Bollinger to measure market volatility and identify overbought and oversold conditions. They consist of:
A middle band (usually a 20-period Simple Moving Average (SMA)).
An upper band (SMA + 2 standard deviations).
A lower band (SMA - 2 standard deviations).
👉 Key Uses of Bollinger Bands:
Identifying volatility expansion & contraction
Spotting potential trend reversals
Generating buy & sell signals
Confirming breakout or fakeout movements
📊 How to Calculate Bollinger Bands
Formula:
1️⃣ Middle Band: 20-period SMA 2️⃣ Upper Band: 20 SMA + (2 × Standard Deviation) 3️⃣ Lower Band: 20 SMA - (2 × Standard Deviation)
✅ Example Calculation:
Assume a stock's last 20 closing prices have a 20-day SMA of 100, and the standard deviation is 5.
Middle Band = 100
Upper Band = 100 + (2 × 5) = 110
Lower Band = 100 - (2 × 5) = 90
Thus, the price is expected to stay between 90 and 110, and breakouts beyond this range may indicate potential trading opportunities.
🔥 Best Bollinger Bands Trading Strategies
1️⃣ Bollinger Band Squeeze Strategy
📌 Concept: When Bollinger Bands contract, volatility is low, and a breakout is likely.
BUY when price breaks above the upper band after a squeeze (bullish breakout).
SELL when price breaks below the lower band after a squeeze (bearish breakdown).
2️⃣ Bollinger Band Reversal Strategy
📌 Concept: Price often reverts to the mean after hitting the upper or lower band.
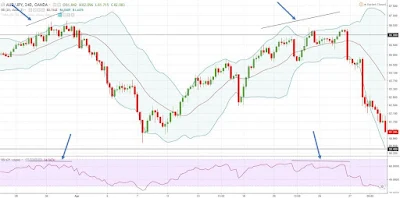
BUY when the price touches the lower band and reverses up.
SELL when the price touches the upper band and reverses down.
3️⃣ Double Bollinger Bands Strategy
📌 Concept: Use two sets of Bollinger Bands (e.g., 20, 2 & 20, 1) to filter noise.
BUY when the price is above both middle bands.
SELL when the price is below both middle bands.
4️⃣ Bollinger Bands + RSI Strategy
📌 Concept: Use Bollinger Bands with the Relative Strength Index (RSI) for confirmation.
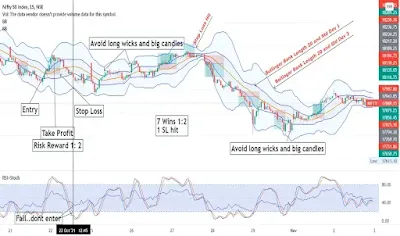
BUY when RSI is below 30 & price touches the lower Bollinger Band.
SELL when RSI is above 70 & price touches the upper Bollinger Band.
5️⃣ Bollinger Bands Breakout Strategy
📌 Concept: A strong move beyond the bands signals a continuation of the trend.
BUY if price breaks and closes above the upper band with strong volume.
SELL if price breaks and closes below the lower band with strong volume.
⏳ Best Timeframes for Bollinger Bands
📌 Intraday Traders: 5-minute, 15-minute, 30-minute charts 📌 Swing Traders: 1-hour, 4-hour charts 📌 Long-Term Traders: Daily, Weekly charts
📈 Stocks & Index Trading Using Bollinger Bands
✅ Best Stocks for Bollinger Bands:
Trending stocks with high volatility
Stocks with regular cycles of expansion & contraction
✅ Best Indices for Bollinger Bands:
NIFTY 50, SENSEX, S&P 500, NASDAQ, Dow Jones
🎯 Stop-Loss & Target in Bollinger Bands Trading
✅ Stop-Loss Placement:
Below the lower band in a buy trade
Above the upper band in a sell trade
✅ Target Placement:
Middle Bollinger Band (20 SMA)
Next key resistance or support level
🚀 Advanced Bollinger Bands Variants & Techniques
🔹 Bollinger Bands Width (BBW)
Measures the distance between upper & lower bands
Low BBW indicates low volatility, potential breakout ahead
Measures the distance between upper & lower bands
Low BBW indicates low volatility, potential breakout ahead
🔹 Bollinger Bands %B Indicator
Shows price position relative to the bands
%B above 1 = overbought, %B below 0 = oversold
Shows price position relative to the bands
%B above 1 = overbought, %B below 0 = oversold
🔹 Bollinger Keltner Squeeze
Combines Bollinger Bands & Keltner Channels
A squeeze between these bands signals a powerful breakout
Combines Bollinger Bands & Keltner Channels
A squeeze between these bands signals a powerful breakout
🔥 Final Thoughts: Should You Use Bollinger Bands?
✅ Great for trend & volatility analysis ✅ Works well when combined with RSI, MACD, and Volume indicators ✅ Best in trending markets, avoid in sideways markets
💡 Pro Tip: Bollinger Bands are most effective when combined with other indicators for better accuracy!
📢 Do you use Bollinger Bands in your trading? Share your thoughts in the comments! 🚀
#BollingerBands #TechnicalAnalysis #StockMarket #TradingIndicators #PriceAction #SwingTrading #DayTrading
Meta Description:
"Learn everything about Bollinger Bands – from basics to advanced strategies. Discover how to use Bollinger Bands for trading, set stop-loss and targets, and apply them to stocks and indices. Perfect for beginners and pros!"


